
Installing Kibana
HCL Commerce Search 9.1 uses Elasticsearch to hold all the index data. With this move Elasticsearch now comes a very important piece of the solution and as such it should be monitor and tuned correctly to your site so that it performs optimally. I plan to make a future to provide you with some information on how to tune Elasticsearch, for now we I will concentrate on how to install kibana which is a tool that help you to monitor your Elasticsearch cluster.
In this post I plan to document the steps that I followed to install kibana using the bitnami helm charts. During this exercise I enlisted the help of my good friend Raimee as I knew he had done it before, and indeed he did. Is always good to have a wingman!
Most of the install that we do in K8S are straight forward, you find the helm charts, follow the install instructions, but every once in a while there is a bit of gotcha, I am happy to report that there wasn’t too many on this kibana install process.
Assumptions
We are starting from the point that you already have a version of Elasticsearch installed and working. In my case I had Elasticsearch installed under a namespace elastic.
> kubectl get namespaces
NAME              STATUS   AGE
elastic           Active   209d
0. Official documentation from bitnami
- Read through the following official information: https://github.com/bitnami/charts/tree/master/bitnami/kibana/
- Know what version of Elasticsearch you are using to find out what version of Kibana you need. Use this matrix to help you find the kibana version that you will need for a particular Elasticsearch (click on Product compatibility): https://www.elastic.co/support/matrix
1. Add the bitnami repo
helm repo add bitnami https://charts.bitnami.com/bitnami
2. Install kibana
-
Find out the service of your elasticsearch:
kubectl get svc -n elasticangelvera@Angels-MBP ~ % kubectl get svc -n elastic NAME TYPE CLUSTER-IP EXTERNAL-IP PORT(S) AGE hcl-commerce-elasticsearch ClusterIP 23.345.123.230 <none> 9200/TCP,9300/TCP 209d hcl-commerce-elasticsearch-headless ClusterIP None <none> 9200/TCP,9300/TCP 209d -
In our case we needed kibana 7.12, so we use the following command (you will need to modify the host, port and image.tag)
helm install my-kibana bitnami/kibana -n elastic --set "elasticsearch.hosts[0]=hcl-commerce-elasticsearch,elasticsearch.port=9200" --set image.tag=7.12.0
3. Testing kibana
To ensure kibana comes up correctly by monitoring the log (this is your POD name: my-kibana-7c9959548b-lmf27): kubectl logs -n elastic my-kibana-7c9959548b-lmf27 -f
If you see a message like is incompatible with the following Elasticsearch nodes in your cluster that is an error about the version of Kibana not able to work with the Elasticsearch version installed. Refer to the Step 0 and find out what version you need to install using the image.tag attribute.
-
To see the Kibana UI, you will use port-forward:
kubectl port-forward svc/my-kibana 5601 -n elastic - Launch your browser and go to http://localhost:5601/
- Click Explore on my own
- Open the hamburger menu on the top left.
- Scroll all the way down to Stack Monitoring
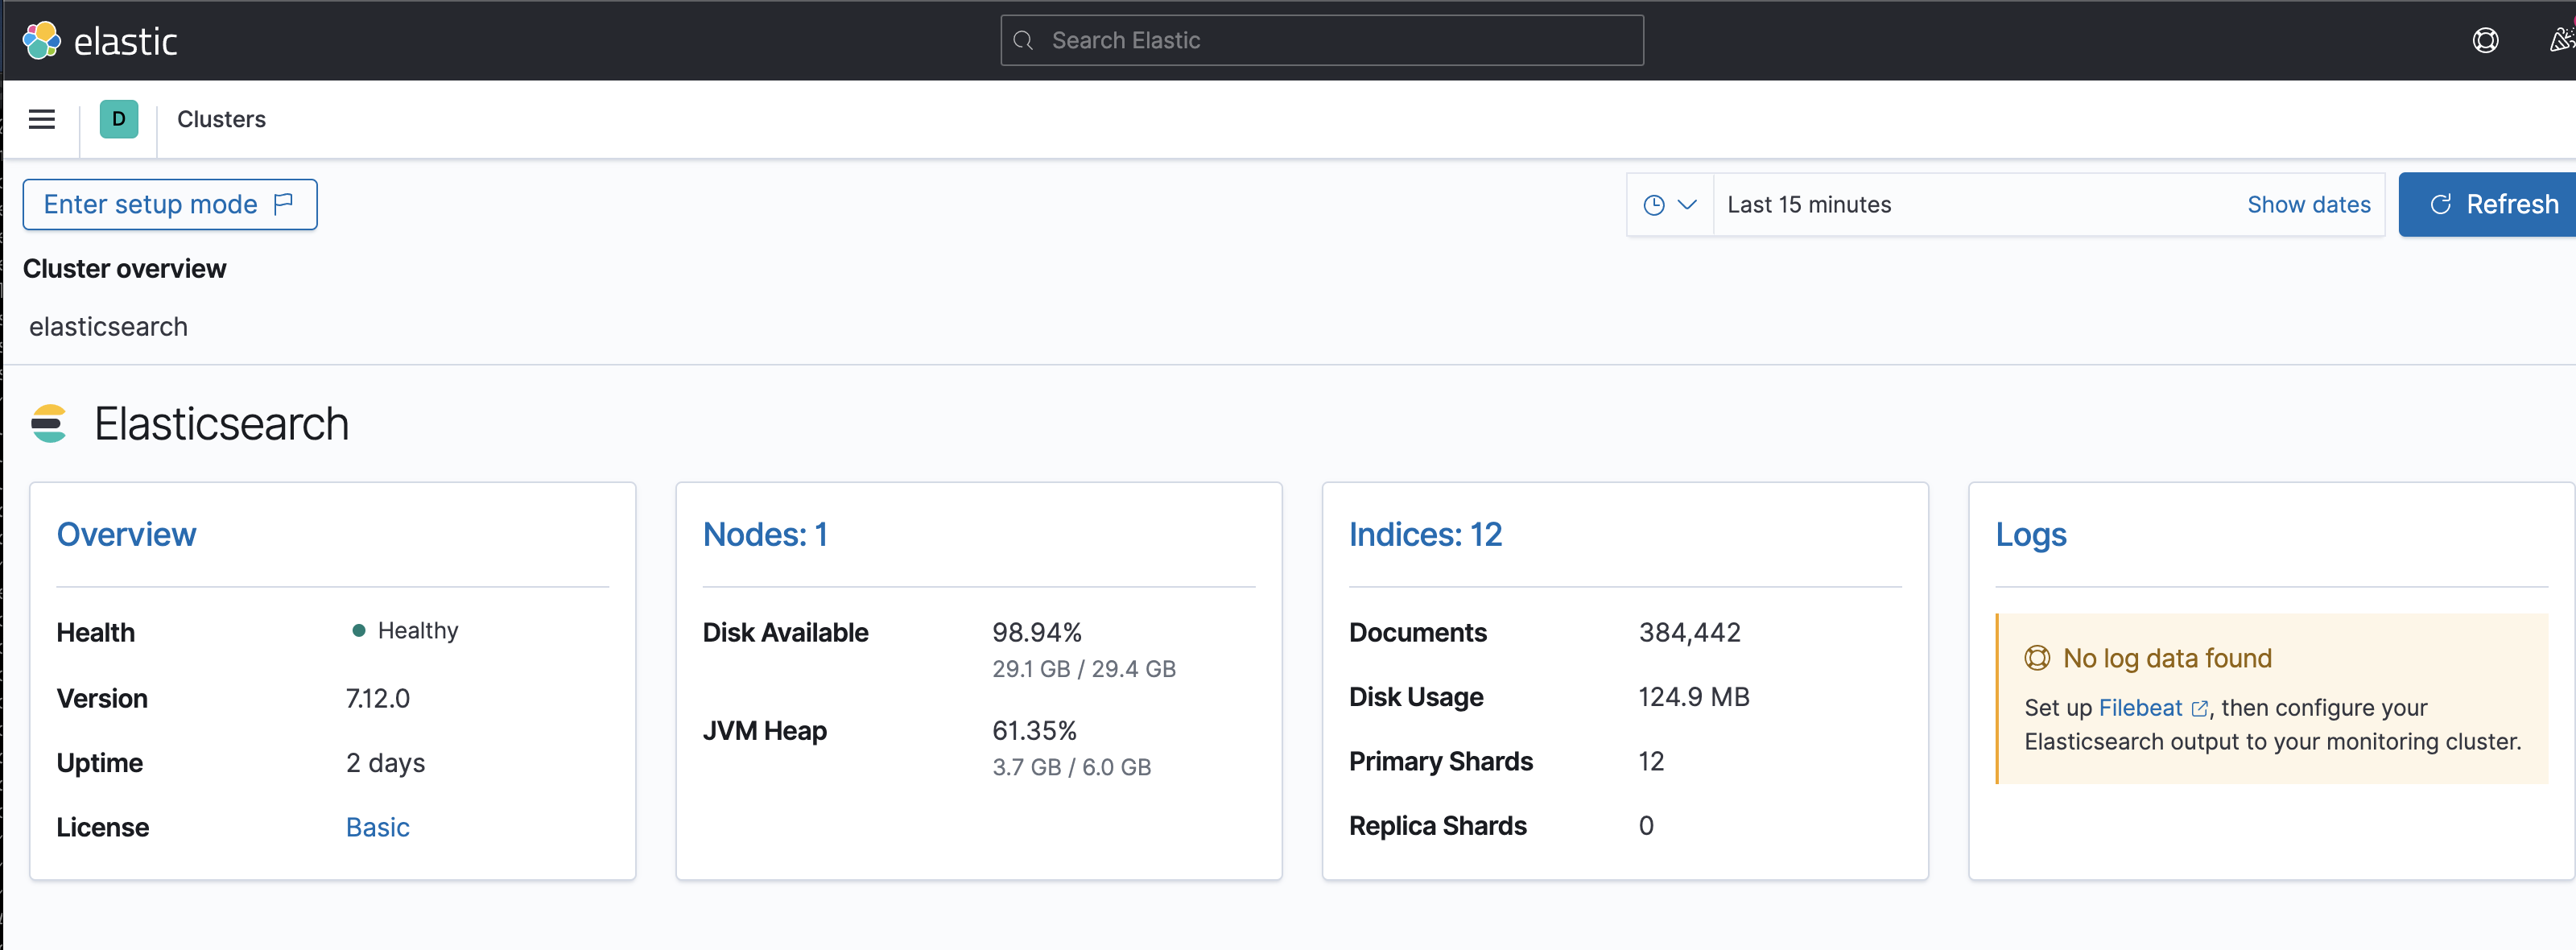
From there you should be able to see something like the screenshot below, where you can navigate to your Nodes or Indices and use the different graphs to monitor the state of your Elasticsearch cluster.
Leave a comment